Tea Production
Tea industry


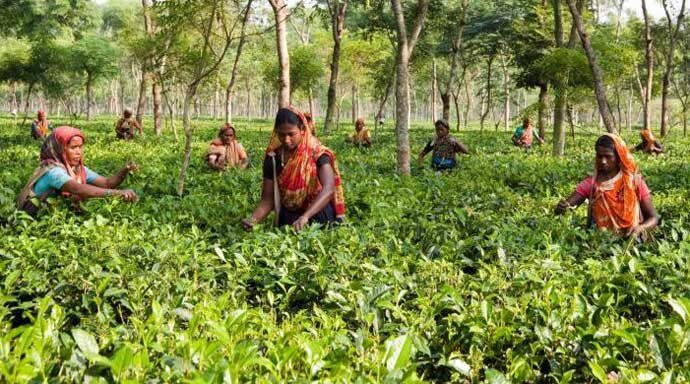
The tea industry sustained major damage during the war of liberation in 1971. The Bangladesh government appointed a committee in 1972 to investigate into the problems faced by the tea planters. Some useful suggestions were: (a) to raise productivity, (b) to reduce cost of production, and (c) to promote and strengthen the process of marketing. About 0.15 million people are directly employed in the tea industry. Many more people are indirectly employed in other sectors related to tea processing and business. In the 1970s, 1980s and 1990s overseas firms remained in the dominant position both in area and in production. In 2010 the number of tea gardens was 162.
Bangladesh exports tea to Afghanistan, Australia, Belgium, China, Cyprus, France, Germany, Greece, India, Iran, Japan, Jordan, Kazakhstan, Kenya, Kuwait, KSA, Kyrgyz Republic, Oman, Pakistan, Poland, Russia, Sudan, Switzerland, Taiwan, UAE, UK and USA.
History of Bangladesh Tea Industry dates back to 1840 when a pioneer tea garden was established on the slopes of the hills in Chittagong where the Chittagong Club now stands. First commercial tea garden was established in 1857 at Mulnichera in Sylhet. During the partition in 1947, Bangladesh (the then East Pakistan) owned 103 tea estates, covering 26,734 hectares of tea plantation with annual production of 18.36 M.Kg. with an yield of about 639 Kg. per ha. Home consumption was around 13.64 M. Kg. upto 1955. After that home consumption went up rapidly and Government imposed 3% mandatory extension of tea area per year in 1961. Ten years later by 1970, tea area was extended to 42,658 hectares and production was incrased to 31.38 M.Kg.
During liberation war in 1971, our tea industry suffered colossal damages which resulted in poor management, high vacancies, insufficient inputs, dilapidated factory machinery, inadequate maintenance etc. leading to lower yield and poor quality of tea. But the industry soon got a big push on behalf of the government through a massive development program (BTRP-1980-92) with the financial and technical assistance of the British ODA and EEC and production increased to 65.84 million kg. with per/ha. yield of 1255kg. in 2013.
Types of Tea
In presence, there are almost 30 countries producing 70% black tea, 25% green tea and the remaining 5% consisted of oolong tea. Like black tea, green and oolong tea are widely made in Asian countries to consume as a beverage and has been familiar in China and Japan from centuries.
- Green tea (i.e.) unfermented tea
Green tea is derived solely and exclusively, and produced by acceptable processes, notably enzyme inactivation and commonly rolling or comminution, followed by drying, from the tender leaves, buds, and shoots of varieties of the species Camellia sinensis (L.) O. Kuntze, known to be suitable for making tea for consumption as a beverage.
Green tea, called non-fermented tea has a more subtle, delicate flavour, and far less caffeine than fermented tea, is medicinally beneficial because the non-fermented leaves retain a higher concentration of natural vitamins and polyphenols than fermented counterparts.
- Black tea (i.e.) fully fermented tea
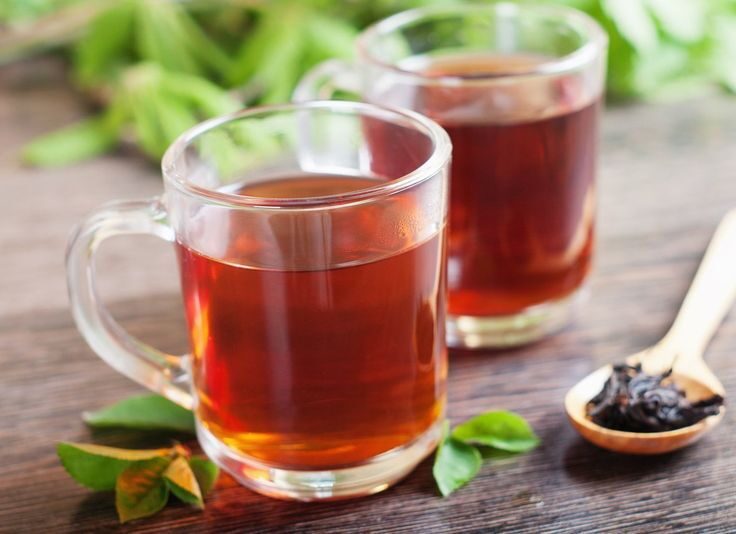
Black tea is a type of tea that is more oxidized than oolong, green and white teas. Black tea is generally stronger in flavor than the less oxidized teas. Two principal varieties of the species are used – the small-leaved Chinese variety plant (C. sinensis subsp.sinensis), used for most other types of teas, and the large-leaved Assamese plant (C. sinensis subsp. assamica), which was traditionally mainly used for black tea, although in recent years some green and white have been produced.
- Oolong tea (i.e.) partially fermented tea
Oolong is a traditional Chinese tea produced through a unique process including withering the plant under the strong sun and oxidation before curling and twisting. Oolong tea is a semi-fermented tea especially good for digestion, is advised to take after a large meal. The chemical compositions counted in semi-fermented oolong tea are in the ranges of non-fermented green tea to fully fermented black tea. Most oolong teas, especially those of fine quality, involve unique tea plant cultivars that are exclusively used for particular varieties. Oolong is especially popular with tea connoisseurs of south China and Chinese expatriates in Southeast Asia.
- Instant tea (i.e.) water soluble tea
In recent times, "instant teas" are becoming popular, similar to freeze-dried instant coffee. Similar products also exist for instant iced tea, due to the convenience of not requiring boiling water. Instant tea was developed in the 1930s, but not commercialised until later. Nestlé introduced the first instant tea in 1946, while Redi-Tea introduced the first instant iced tea in 1953. These products often come with added flavours, such aschai, vanilla, honey or fruit, and may also contain powdered milk. Tea connoisseurs tend to criticise these products for sacrificing the delicacies of tea flavour in exchange for convenience.
- White tea
White tea is a lightly oxidized tea grown and harvested primarily in China, mostly in the Fujian and Zhejiang province. More recently it is grown in Taiwan, India, Northern Thailand and Eastern Nepal. White tea comes from the buds and leaves of the Chinese Camellia sinensis plant. The leaves and buds are allowed to wither in natural sunlight before they are lightly processed to prevent oxidation or further tea processing. The name "white tea" derives from the fine silvery-white hairs on the unopened buds of the tea plant, which gives the plant a whitish appearance. The beverage itself is not white or colourless but pale yellow.
Internal Production, Consumption & Export
|
Year |
Production (M. Kg) |
Internal Consumption (M. Kg) |
Export (M. Kg) |
Export Value (M. Tk) |
|||||
|
2001 |
53.15 |
36.95 |
12.92 |
894.99 |
|||||
|
2002 |
53.62 |
41.50 |
13.65 |
939.93 |
|||||
|
2003 |
58.30 |
37.44 |
12.18 |
915.07 |
|||||
|
2004 |
56.00 |
43.33 |
13.11 |
934.04 |
|||||
|
2005 |
60.14 |
43.30 |
9.01 |
742.62 |
|||||
|
2006 |
53.41 |
40.51 |
4.79 |
469.59 |
|||||
|
2007 |
58.19 |
46.27 |
10.56 |
899.01 |
|||||
|
2008 |
58.66 |
52.12 |
8.39 |
976.95 |
|||||
|
2009 |
59.99 |
53.74 |
3.15 |
433.50 |
|||||
|
2010 |
60.04 |
57.63 |
0.91 |
176.68 |
|||||
|
2011 |
59.13 |
58.50 |
1.47 |
213.51 |
|||||
|
2012 |
62.52 |
61.19 |
1.50 |
222.28 |
|||||
|
2013 |
66.26 |
64.00 |
0.54 |
133.04 |
|||||
|
2014 |
63.88 |
67.17 |
2.66 |
281.72 |
|||||
|
2015 |
67.38 |
62.26 |
|
|
|||||
|
Year |
Production ( Million kg) |
Internal consumption ( Million kg) |
Export ( Million kg)
|
Export Value ( Million Tk) |
|
||||
|
2010 |
60.04 |
57.63 |
0.91 |
176.68 |
|
||||
|
2011 |
59.13 |
58.50 |
1.47 |
213.51 |
|
||||
|
2012 |
62.52 |
61.19 |
1.50 |
222.28 |
|
||||
|
2013 |
66.26 |
64.00 |
0.54 |
133.04 |
|
||||
|
2014 |
63.88 |
67.17 |
2.66 |
281.72 |
|
||||
For more information visit:
